The Software
 |
| Figure 1: Pix 4D logo |
Pix 4D is a powerful software system that can convert images captured through areal photography into intricate orthomosaic maps. It is useful in a very broad range of UAS mapping applications such as management of mining extractions and monitoring crop field health with NDVI to name a few. (for more on Pix 4D applications click
here). Out of the image mosaic programs I have used by far, this software is by far the most user friendly if you are new to this field. Probably the most difficult part of using this software is proper data collection. For best results, it is recommended that the imagery you collect has a frontal overlap of 75% (that is between sequential pictures, and at least a 60% side by side overlap (between passes) and without using ground control points which aren't required but are necessary for lengthy surveys, a steady altitude must be flown to get accurate elevation data. Data collection increases in complexity if you are imaging a uniform field, such as a snowy landscape or crop plot where the images collected may all look similar with out distinctive landmarks. To solve this problem, it is recommended that the UAS flight be carried out at low altitude to increase visual content with a 85% frontal and 70% side overlap and a grid images aquisition plan is used. It is also important if you are imaging a uniform field that you are collecting accurate image geolocation and the project is set to alternate processing mode. Though these can be difficult parameters depending on your equipment, Pix4D has a functionality called Rapid Check which will provide a useful, quick preview of the project reconstruction and will assess the quality of data right away so you can know how your data turned out before you leave the site. Another excellent feature of Pix4D is the ability to process multiple flights into a single orthomosaic. Multiple flight processing can be done if the individual images of both flights have enough overlap, the flights themselves have enough overlap so that they can be oriented and stitched together, and if the images are taken under (ideally) similar environmental conditions. Another great feature of Pix 4D is its ability to process oblique imagery such as the imagery we collected of the concession stand in
week 5. The recommended flight path for this kind of operation asks to circle the structure first with a camera angle of 45 degrees and collecting images ever 5-10 degrees for sufficient overlap and the next flybys should be at higher altitude and a decreased camera angle. Oblique imagery cannot be used to create an orthomosaic. Now that you know about the software, let me how you how it works.
How to Use Pix4D
Step 1) Open Pix4D
When you open Pix 4D you will be prompted with the following screen. From here, go to the upper left corner and click the project button. From the drop down menu, select new project.
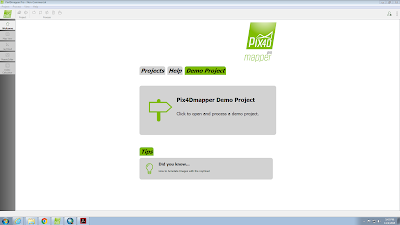 |
| Figure 2: Pix4D homepage |
Step 2) Create a new project
From here, Pix4D will bring you step by step through the process of creating your orthomosaic. In the new project window, you choose a name for your project, where you want it to save, and a project type.
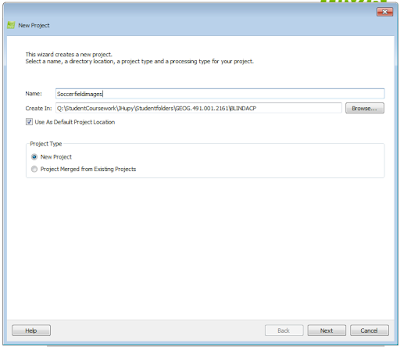 |
| Figure 3: New Project information window |
Step 3) Select Image Data
The next window prompts you to add your imagery. Select all the images that pertain to your study and add them to your project. A check or X will appear by the "Enough images are selected." if you get a green check mark, you can proceed to the next step.
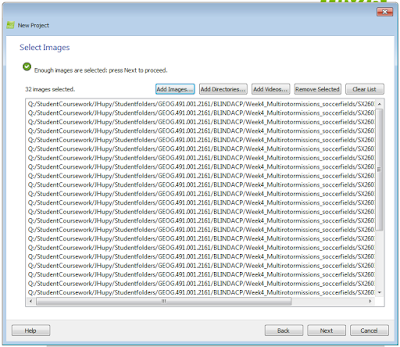 |
| Figure 4: Select images for your study |
Step 4) Verify image properties
The next window you are prompted with will show you if your data is able to be geolocated and what type of device the images were taken with. If the images are not automatically geolocated, but you do have geolocation data, such as imagery taken with GEMs hardware then this data can be added under the 'Image Geolocation' heading. When you add the geolocation data to the images make sure that your latitude and longitude are correct and not flipped. You will also notice that the number of geolocated Images will increase giving you the okay to move forward. If your images are automatically geolocated such as with the data from a Canon SX260 that I used below, then you should see all green check marks and you are ready to move on after a brief overview.
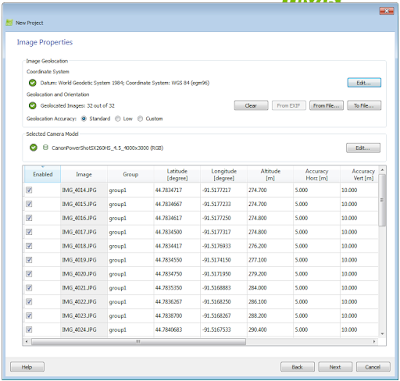 |
| Figure 5: Set up image information |
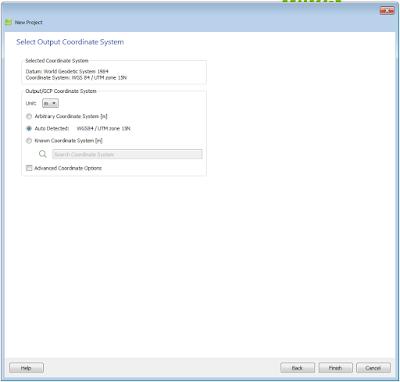 |
| Figure 6: Setting up an output coordinate system. This can be detected automatically, but you can edit it if need be |
Step 5) Select your map type
Here you can select from a variety of map types that suit your needs. Since we gathered a series of nadir images, we want to make a 3D map. However, if you collected oblique images of a structure, then you would select 3D model.
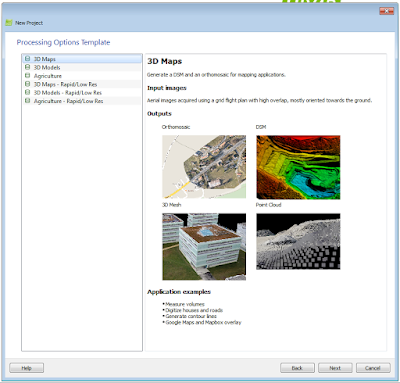 |
| Figure 6: Selecting your map type |
Step 6) Processing
When you hit next on the previous screen processing is ready to begin. The software processes in three steps including, Initial Processing, Point Cloud and Mesh, and the last step is DSM, Orthomosaic and Index. It takes a lot of processing power to fully develop the project so expect this step to take an hour or so depending on your computer's processing ability and the number of images in your study. In the meantime you can view images of the point cloud and an overlay of your flight path on a satellite image of your study area.
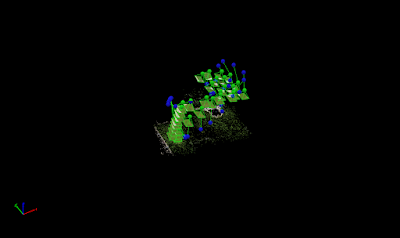 |
| Figure 7: Point cloud in blank space |
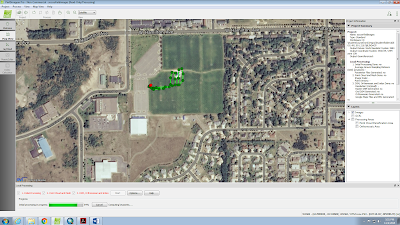 |
| Figure 8: Flight path overlay on satellite image with picture locations marked |
Step 7: View quality reports along the way
As each step concludes processing, you will be prompted with a quality report. The quality report will show you copious amounts of data relating to your data and how it is being processed. Such things include, image previews, file names, area measurements and so on. This is very useful to keep an eye on your data while it is being processed and even more important after to ensure you have the quality data that you or your employer need.
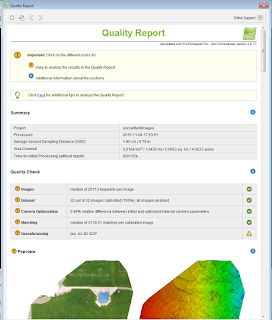 |
| Figure 9: Quality report sample |
Step 8: Enjoy your orthomosaic
Once processing is complete, click on ray cloud on the left side bar. From here you can manipulate you mosaic to your liking to show the best resolution. At first you will only see a series of pixels floating in space, so to fix this you must check the box by 'Triangle Meshes' and this will give you your orthomosaic image shown below. You can also study specific areas such as a sidewalk or building on your orthomosaic by creating objects that outline the area of interest. When you do this, you will be given data such as elevation and area of the object you want to study. Another neat feature is the ability to create a 3D fly through video which could be useful in presenting data. That feature can be found by clicking the video animation button on the right of the top task bar.
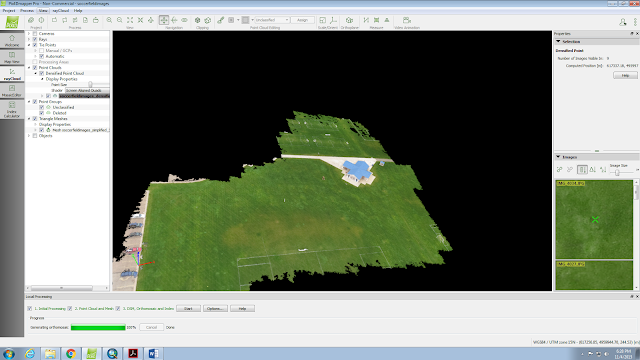 |
| Figure 10: Final processed orthomosaic |
Pix 4D files can then be transferred to a geodatabase in ESRI ArcMap in order to create maps from the processed data. You can see my maps as well as some area and volumetric calculations done with Pix4D in figures 6-8
here.
In Review
Pix4D is a highly advanced, powerful and easy to use software for creating orthomosaic imagery from UAS photography with a wide range of applications. Though the user interface is friendly, you do need to pay close attention to detail while collecting your image data making sure you follow the recommendations for proper flight altitude and image overlap for your given study. Pix4D gives you the ability to take non-geolocated images and later assign geolocation data to the images which is helpful if you have image gathering equiptment such as GEMS which doesn't automatically add geolocation data to its images. The only downfalls of this software is the amount of processing power that it needs. The larger the area you wish to map, or the more images you take, the longer it will take to process in the magnitude of hours. Pix4D will also burn a hole in your pocket many thousands of dollars deep so don't expect this program to come cheap if you want to use it for personal use. Overall Pix4D is an excellent program which is easy for anyone to use and I would recommend using it.


