Wednesday, December 9, 2015

Volumetric Analysis using PIX 4D and ESRI software

Introduction

Volumetrics as it relates to geospatial analysis refers to the calculation of three dimensional data from collected survey data, whether that data is collected via a ground survey crew, by areal photography with UAS or other means. A situation where you would need to employ volumetrics, is if you were tasked with analyzing the volumes of natural or man-made objects that are scattered throughout a study area, such as hills, piles of mined materials, buildings or pits. This situation often arises in the mining industry where a company may require knowledge of the volumes of their material stockpiles or the amount of material that has been removed from the mine. Initial data can be collected in a variety of ways as mentioned above through ground survey crews or UAS. Hiring a whole crew to survey a mine can cost a large amount of time and money depending on the size of the survey, while a UAS operation can photograph the entire area from above and software methods can be employed to process the data. Most companies wanting to save money would most likely choose to conduct a UAS operation, and with improvements being made to software programs on a regular basis, they are becoming more and more accurate at processing volumetric data.  Software programs such as ESRI's ArcMap and Pix4D provide the necessary tools for you to perform volumetric calculations of processed geospatial data with relative ease.

For the following three tests of software volume calculation ability, previously collected data collected of the Litchfield mine is used. This data was collected via UAS, but was not collected in the geography 390 course. Three aggregate piles were selected to be analysed for each of the three tests performed.

Using Pix 4D to Calculate Volume

Figure 1: Calculating the volume of a pile in
Pix4D using the volume tool
source:http://npb-uas.blogspot.com/
Perhaps the simplest volumetric analysis was done using Pix 4D. Once the processed data was loaded, the measure button, located in the tool bar at the top of the program window was pressed prompting a menu of tools. From here, the volume tool button was pressed which allows the user to select points around the base of object being measured. The more points selected around the base, the more accurate the lower height limit for the volume calculation will be. Once all the points needed were selected about the base of one of the piles,  then the calculate values button can be pressed and you are prompted with the volume calculation. [[Unfortunately, the both Pix4D data sets that were provided were corrupted so I used data found by another student with better luck than I.]]

Using ArcMap to Calculate Volume From Rasters

The ESRI program ArcMap also has the ability to calculate volumetric data. The first way that was tested was through raster clips. Within the geodatabase created in ArcMAp, a feature class polygon was created for each pile, making sure that the polygon encompassed the pile with a large enough border of flat ground to be used as a  standard plane in which to gauge the starting height of the pile. Once the polygon was created, an extract by mask was done to make the each pile its own separate entity from the initial raster so it could be manipulated. The identity tool was then used to find the plane height, or ground elevation surrounding the pile. This was done, simply by selecting the identity tool and then clicking the area of interest to get elevation data. Several points were analyzed and an average height was taken note of for each pile. Finally, the surface volume tool was used. When opened, the surface volume tool prompts you to select your input surface (pile raster), output file (where you want the text file data saved), Reference plane (Calculate volume above or below plane), Plane height (Average height calculated with identity tool), and Z factor (should be 1). When the required information was entered, the OK button was pressed and a text file containing the volume of the pile was created. The map in figure 2 shows the piles labeled along with the volume that was calculated using this method


Figure 2: Litchfield mine map created  with ArcMap showing the labeled piles
and their calculated volumes using the surface volume tool on raster clips.
Using ArcMap to Calculate Volume from TIN
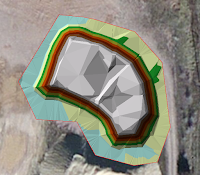
Figure 3: Pile 1 TIN

A TIN or Triangulated Irregular Network uses triangulation for a given number of points to create better surface definition for a selected area. The raster clips used previously are easily converted to TINs by using the Raster to TIN tool which converts the raster into what looks like a colorful topographic  model seen in figure 3. When using the Raster to TIN tool, the more triangulations you specify the better the surface definition, however, more triangulations means a longer processing time. The next step in using TINS to calculate volume is adding surface information. This can be done with the Add Surface Information 3D analyst tool which lets you analyze each pile individually for information such as  Z_Max, Z_Min, Z_Mean, Surface Area and Slope. The Z_mean value is important because it provides a average elevation which will eliminate outlying elevation values for better results when calculating the volume.  Next, the Polygon Volume tool is used to calculate the volume of each pile. Here, we use the data of Z_min found in the previous step to designate the minimum height of the volume calculation and then calculate the volume above that point. Once this is done for each pile, data collection is complete. It is important that the polygon volume tool is used because other volume tools like the surface volume tool used to calculate volume of the raster clips aren't compatible with TIN data, and won't take into consideration the surface information that was collected.
Conclusion


The above table contains the data that was collected in this activity through collecting volumetric data from three aggregate piles using three different methods.  There are obviously differences in this calculated data, and there isn't a way to tell which is the most accurate without knowing the volume definitively. However, the TIN data seems to be significantly different from the other two methods . The TIN data could be so far off because of when the TIN was created, not enough triangulations were made, and as we found out before, the number of triangulations is directly related to the quality of the TIN. Perhaps increasing this number will bring the TIN volume closer to that of the Pix4D and raster methods. Based on quickness and simplicity, Pix4D would be the most efficient method for calculating volumetric data. It may even be more accurate since for the raster clips, a baseline Z value was, in a way, arbitrarily chosen which increases it's inaccuracy. Another factor that would factor into volumetric calculations in industry would be the availability of software. With the high price of Pix4D, some companies may not have it and therefore other software must be used. If quality time is spent analyzing the data, ArcMap raster clips can be just as accurate.

Tuesday, November 17, 2015

Adding GCPs to Pix4D software

Introduction

Last week we learned how Pix 4D is a powerful tool used in creating excellent orthomosaics and 3D models using geotagged images from the Canon SX260 camera and GEMs imagery with imported GPS coordinates. This week we are using our data collected during our fourth field activity and using ground control points or GCPs to increase the geographic and aesthetic elements of the created geo-referenced mosaics and models.

Summary of Methods

For data collection details refer to link above, but in review: Data was collected using a Canon SX260 camera with CDHK software installed so images could be taken at set intervals over the course of the mission. Before the mission began, 6 GCPs were placed around the study area and the high precision Topcon Positioning System was used to mark each GCPs latitude, longitude and altitude. The Topcon data was saved to a text file to be later imported to Pix4D. The SX260 was mounted to the Matrix UAV to take nadir imagery and a waypoint data was uploaded to the Matrix via Mission Planner. Data was then uploaded to a shared file to be analyzed.

There are multiple ways to add GCPs to a project in Pix 4D. Those being:

  1. Measuring in the field with topographical equipment much like we did
  2. Taking GCPs from currently existing geospatial data and finally taking GCPs from a web map service. So you don't necessarily need your own GCPs, however your final project will be a lot more accurate if you mark
  3. Through collecting GCPs specific to your project.
There are three methods for tying images to GCPs. The first case is the one that we ran and requires that the GCPs have a known coordinate system. Here you can add GCPs to your project, run an initialization, mark the GCPs in the ray cloud and then complete the final two processing steps. The second method involves the a user who doesn't have geolocated images or images and GCPs are geolocated within a local coordinate system. In this case an initialization would be run first, followed by then adding and marking at least three GCPs with rayCloud and then adding more GCPs as necessary followed by running the last two processing steps. Finally, Pix4D allows you to, for any case mentioned in the previous two methods, to Add your GCPs Manually and mark them followed by doing the total processing all at once. This method requires the least amount of intervention, but probably won't produce optimized results in comparison to the first or second methods. More information can be found on the Pix4D support site, here.

Like mentioned earlier, our data was processed using the first method. First, our data which consisted of around 340 georeferenced pictures was added to our Pix4D project, following the same steps as last week. For this exercise we had to select a coordinate system, which for where our study was done was NAD83/UTM zone 15N, which can be found in the drop down menu. After creating the project, the text file containing our GCP information via clicking on the layers menu on the left column, selecting GCP and then Manual Tie Point Manager. It is important to know how your coordinate system is stored since Pix 4D displays them YXZ. Verify your coordinates are cooret before moving on. Once this was done, Initialization was started, making sure the other processing steps remained unchecked. This will show you your initial processing before you optimize the images to the GCPs.


Figure 1: Initial Processing Quality Report. Notice that no GCPs were used in the making of these
 mosaics as indicated by the exclamation point by the Geo-referencing check.  
Once Initial processing was complete, a quality report was generated and saved for comparison to the final processing. Now the GCPs were added. To do this, again the layers drop down menu on the left in rayCloud was clicked, followed by GCP and manual tie point manager. from here you can see each GCP you uploaded underneath. Click on the GCP you want to calibrate and on the left, a properties column will appear. Here you see your GCP that you clicked and how many images you have calibrated (should be 0 to start). Below that you will see an image similar to that of Figure 2. only you will not see the GCP marker. This is where the image believes the GCP is. To fix this, zoom out until you see the marker and then zoom back in, as close to center of the GCP as you can and click there. A yellow circle will appear indicating the new, calibrated location of the GCP.

Figure 2: GCP calibration images. Yellow circles indicate a calibrated image
and the Green X indicates the new, universal location of the GCP in your imagery
Continue to tag these images, marking the center of the GCP marker and do this for at least 10 images to solidify the location. As you move along, Pix4D automatically calibrates images which means you won't have to tag the hundreds of images that contain your GCP. Once you are satisfied with the calibration, click apply and your changes will be applied to your imagery. Do this step for each GCP and when you are done and changes have been applied, hit the optimize button which will optimize your imagery. Then when you are satisfied, click the process buton on the top menu bar and from that drop down menu, select reoptimize. Reoptimization will ensure your GCPs are utilized accurately throughout your project. Then a generate a quality report to see the changes.
Figure 3: Optimized data quality report. Notice how the study area grew in
size with the addition of GCPs.
From this point, the final two processing steps can be completed and depending on the processing power of your computer, it will take a fair amount of time.When processing is done, a map such as the one in figure 4 can be created. Plotted here are the GPS coordinates as they were recorded by several different means in a previous experiment with varying degrees of accuracy.

Figure 4: Map of study area with overlayed GPS coordinates as calculated by
various GPS enabled units
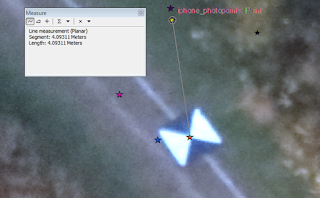
In ArcMap you can calculate the error of the various GPS systems using the measure tool in the top tool bar. In Figure 5, the distance between the most accurate GPS point and the iPhone geotagged photo is measured,
Figure 5: Measuring distance between the Topcon GPS unit and the iPhone 


Conclusion:

Pix4D remains to be a user friendly source for processing geospatial data and as shown above becomes even more accurate with the addition of GCPs. It is worthy to note that you do not need to have collected GCP data before collecing your imagery data, but do know that the quality of your project depends on the amount of work that you put into data collection, so for accurate results, collect GCPs with the most accurate means possible. Collecting GCP data is considered a must when it comes to conducting long-term surveys and I would uphold my suggestion from last week to use Pix4D for processing your data.


Wednesday, November 11, 2015

Pix 4D Software Review

The Software

Figure 1: Pix 4D logo
Pix 4D is a powerful software system that can convert images captured through areal photography into intricate orthomosaic maps. It is useful in a very broad range of UAS mapping applications such as management of mining extractions and monitoring crop field health with NDVI to name a few. (for more on Pix 4D applications click here). Out of the image mosaic programs I have used by far, this software is by far the most user friendly if you are new to this field. Probably the most difficult part of using this software is proper data collection. For best results, it is recommended that the imagery you collect has a frontal overlap of 75% (that is between sequential pictures, and at least a 60% side by side overlap (between passes) and without using ground control points which aren't required but are necessary for lengthy surveys, a steady altitude must be flown to get accurate elevation data. Data collection increases in complexity if you are imaging a uniform field, such as a snowy landscape or crop plot where the images collected may all look similar with out distinctive landmarks. To solve this problem, it is recommended that the UAS flight be carried out at low altitude to increase visual content with a 85% frontal and 70% side overlap and a grid images aquisition plan is used. It is also important if you are imaging a uniform field that you are collecting accurate image geolocation and the project is set to alternate processing mode. Though these can be difficult parameters depending on your equipment, Pix4D has a functionality called Rapid Check which will provide a useful, quick preview of the project reconstruction and will assess the quality of data right away so you can know how your data turned out before you leave the site. Another excellent feature of Pix4D is the ability to process multiple flights into a single orthomosaic. Multiple flight processing can be done if the individual images of both flights have enough overlap, the flights themselves have enough overlap so that they can be oriented and stitched together, and if the images are taken under (ideally) similar environmental conditions. Another great feature of Pix 4D is its ability to process oblique imagery such as the imagery we collected of the concession stand in week 5. The recommended flight path for this kind of operation asks to circle the structure first with a camera angle of 45 degrees and collecting images ever 5-10 degrees for sufficient overlap and the next flybys should be at higher altitude and a decreased camera angle. Oblique imagery cannot be used to create an orthomosaic. Now that you know about the software, let me how you how it works.

How to Use Pix4D

Step 1) Open Pix4D

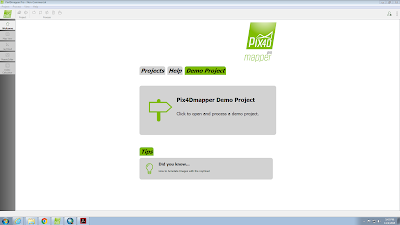
When you open Pix 4D you will be prompted with the following screen. From here, go to the upper left corner and click the project button. From the drop down menu, select new project.


Figure 2: Pix4D homepage

 Step 2) Create a new project

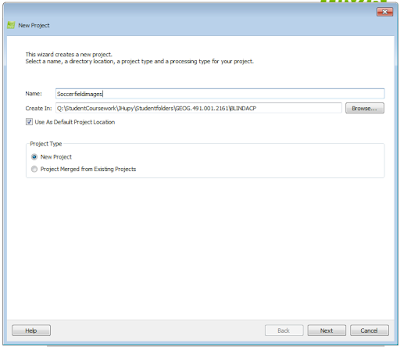
From here, Pix4D will bring you step by step through the process of creating your orthomosaic. In the new project window, you choose a name for your project, where you want it to save, and a project type.

Figure 3: New Project information window
 Step 3) Select Image Data

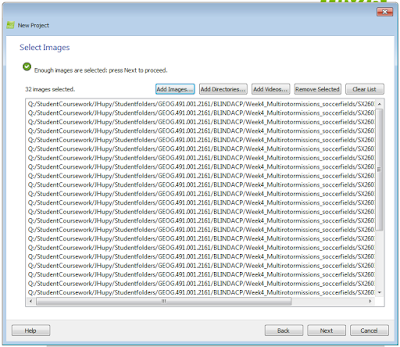
The next window prompts you to add your imagery. Select all the images that pertain to your study and add them to your project. A check or X will appear by the "Enough images are selected." if you get a green check mark, you can proceed to the next step.
Figure 4: Select images for your study
 Step 4) Verify image properties

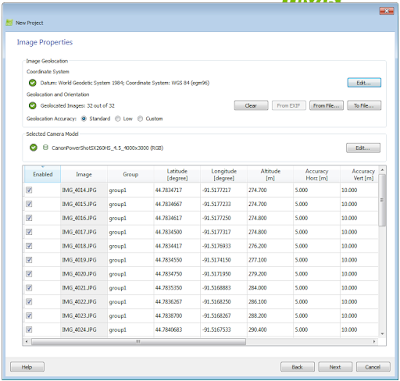
The next window you are prompted with will show you if your data is able to be geolocated and what type of device the images were taken with. If the images are not automatically geolocated, but you do have geolocation data, such as imagery taken with GEMs hardware then this data can be added under the 'Image Geolocation' heading. When you add the geolocation data to the images make sure that your latitude and longitude are correct and not flipped. You will also notice that the number of geolocated Images will increase giving you the okay to move forward.  If your images are automatically geolocated such as with the data from a Canon SX260 that I used below, then you should see all green check marks and you are ready to move on after a brief overview.
Figure 5: Set up image information
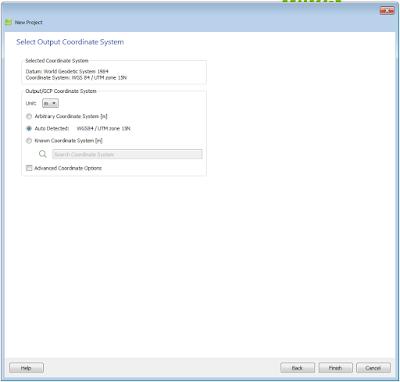
Figure 6: Setting up an output coordinate system. This can be detected automatically, but you can edit it if need be


Step 5) Select your map type

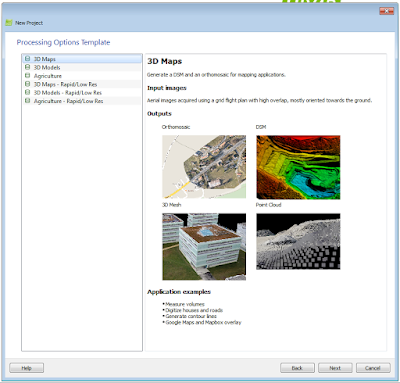
Here you can select from a variety of map types that suit your needs. Since we gathered a series of nadir images, we want to make a 3D map. However, if you collected oblique images of a structure, then you would select 3D model.

Figure 6: Selecting your map type
Step 6) Processing

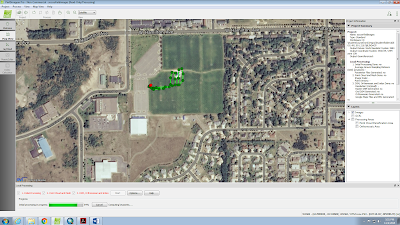
When you hit next on the previous screen processing is ready to begin. The software processes in three steps including, Initial Processing, Point Cloud and Mesh, and the last step is DSM, Orthomosaic and Index. It takes a lot of processing power to fully develop the project so expect this step to take an hour or so depending on your computer's processing ability and the number of images in your study. In the meantime you can view images of the point cloud and an overlay of your flight path on a satellite image of your study area.
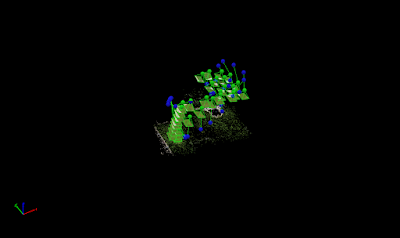
Figure 7: Point cloud in blank space
Figure 8: Flight path overlay on satellite image with picture locations marked 
Step 7: View quality reports along the way

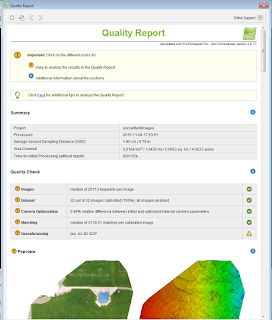
As each step concludes processing, you will be prompted with a quality report. The quality report will show you copious amounts of data relating to your data and how it is being processed. Such things include, image previews, file names, area measurements and so on. This is very useful to keep an eye on your data while it is being processed and even more important after to ensure you have the quality data that you or your employer need.
Figure 9: Quality report sample
Step 8: Enjoy your orthomosaic

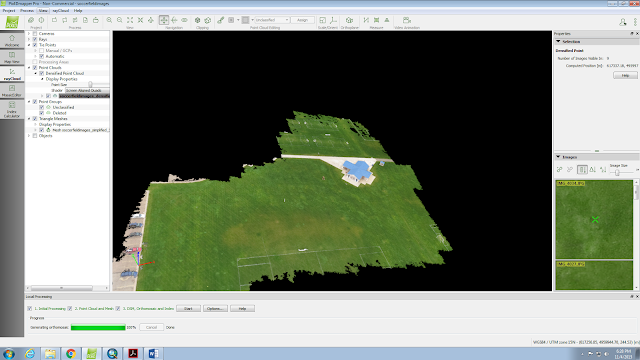
Once processing is complete, click on ray cloud on the left side bar. From here you can manipulate you mosaic to your liking to show the best resolution. At first you will only see a series of pixels floating in space, so to fix this you must check the box by 'Triangle Meshes' and this will give you your orthomosaic image shown below. You can also study specific areas such as a sidewalk or building on your orthomosaic by creating objects that outline the area of interest. When you do this, you will be given data such as elevation and area of the object you want to study. Another neat feature is the ability to create a 3D fly through video which could be useful in presenting data. That feature can be found by clicking the video animation button on the right of the top task bar.
Figure 10: Final processed orthomosaic 
Pix 4D files can then be transferred to a geodatabase in ESRI ArcMap in order to create maps from the processed data. You can see my maps as well as some area and volumetric calculations done with Pix4D in figures 6-8 here.

In Review

Pix4D is a highly advanced, powerful and easy to use software for creating orthomosaic imagery from UAS photography with a wide range of applications. Though the user interface is friendly, you do need to pay close attention to detail while collecting your image data making sure you follow the recommendations for proper flight altitude and image overlap for your given study. Pix4D gives you the ability to take non-geolocated images and later assign geolocation data to the images which is helpful if you have image gathering equiptment such as GEMS which doesn't automatically add geolocation data to its images. The only downfalls of this software is the amount of processing power that it needs. The larger the area you wish to map, or the more images you take, the longer it will take to process in the magnitude of hours. Pix4D will also burn a hole in your pocket many thousands of dollars deep so don't expect this program to come cheap if you want to use it for personal use. Overall Pix4D is an excellent program which is easy for anyone to use and I would recommend using it.

Wednesday, October 21, 2015

GEMs Software Review

This week I will be providing a review of the GEMs software used to develop maps from the data collected in the previous weeks with the corresponding hardware on the multi rotor.


Overview of Software:

The GEo-location and Mosaicing software or GEMs is a used in the compilation of images gathered by the GEMs hardware mounted on a fixed wing or multirotor aerial photography platform. The hardware consists of a multispectral sensor that can collect images in color (RGB), near infrared (NIR) and several forms of normalized difference vegetation index or NDVI. This system was specifically designed to aid in agriculture since the main role of the NDVI imagery is to identify the health of crops and pinpoint any problem areas in a field such as malnourishment or bug infestations. When mounting the hardware to an aerial system it is important to point the antenna away from all magnetic objects or other antennas this will aid in preventing any extraneous signals from disrupting data collection. Adding a copper plate beneath the GEMs will help to act as a faraday cage which will essentially absorb or and eliminate any electronic interference.  It is also important that the hardware mounted facing downwards in a location were vibrations are minimal or dampened to improve image and data quality. As the mission is being flown, data is collected on a SanDisk Extreme 32GB storage device which is able to write data at 100MB/second. The GSD or ground sampling distance is a relationship between the area covered in a pixel at a certain height. For the GEMs the GSD at 200 feet is 2.5 cm and at 400 feet is 5.1, which shows that the relationship between sample height and GSD are near linear. Pixels can also be geo-located to within 1.5 centimeters with field markers at best and without markers between 3 and 5 meters. The sensors are programmed to enhance a variety of parameters such as rate of coverage, field of view, platform altitude, platform velocity, image overlap, percent smear, exposure time and GSDs. These automatic adjustments are invaluable as they save a lot of time in the image collection since you won’t have to worry about doing calculations in the field to measure out these values. At the conclusion of a mission using GEMs, the GPS coordinates are automatically associated with an image for each of the three image types and an orthomosaic is created. The GEMs software allows for two different types of processing when creating a mosaic, which is the compilation of all the images formed into one geo-located image. These processing types are fast and fine mosaicing, where a fast mosaic will be a quickly processed image based on the navigation data corresponding to the individual images and fine will process the image more in depth ensuring proper alignment of the images and creating an overall better quality mosaic. 

GEMs hardware can be used with different software (such as Mission Planner as was used in our class), and if that is the case the following information can be used to ensure successful data collection.

  • Image sensor resolution: 1280 x 960 pixels 
  • Sensor dimensions (active area): 4.8 x 3.6 mm 
  • Pixel size: 3.75 x 3.75 μm 
  • Horizontal Field of View: 34.622 deg 
  • Vertical Field of View: 26.314 deg 
  • Focal length: 7.70 mm 
Using the Software:

To analyse the data previously collected using the GEMs hardware, the imagery data was uploaded onto a computer interface and a file was created to isolate the data for a particular mission. When in the folder, the data is automatically named to represent the time and date that it was collected. This is a useful feature so you can keep track of your images. The data was then able to be uploaded to the GEMs software where the fisrt step is to initialize the NDVI data. This step besides the part where you click the 'Run NDVI initialization' button is automatic and a loading bar will pop up to show you the status of this initialization. Following that, the data was ready to be sent to a program called ArcMap where the data can be visualized and a map can be created. The files that we want to use in ArcMap are called .tiff files which are created when the NDVI data is initialized with the GEMs software. TIFF is a file format that is used to store raster graphics which contain data relating to the color of a pixel. This is important for NDVI images because the color of a pixel determines the health of a that area of vegetation which is the whole purpose of collecting NDVI imagery.

Speaking of pixel colors, here is how pixel color relates to image type:

  • RGB Image: Each pixel contains a certain percentage of Red, Blue or Green which related to color of the image as it pertains to the visible light spectrum
  • NIR (Mono) Image: This is imagery taken near infrared, this imagery is interpreted in such a way so that you can see it since we biologically cannot see in infrared. 
  • NDVI FC1:  Here, the darker orange the pixel, the healthier the vegetation, bad vegetation is dark blue to black in color
  • NDVI FC2: This imagery displays healthy vegetation as green and bad vegetation as red.  In this situation, green is good and red is 'dead' an easy scale to visualize. 
  • NDVI Mono: Here the more white a pixel, the healthier it is. A black pixel would indicate very unhealthy plant life.
Another form of TIFF file is a geoTIFF which allows georeferenced data to be embedded withing the TIFF file. You can probably understand why this would be important if you want to use your imagery for mapping. In ArcMap these geoTIFFs are used to place your image on an underlaying base map of the world, a feat almost impossible if you don't have any geographical reference points. Other image types such as a .jpeg are not automatically geotagged and therefore whould cause problem if you wanted to create a map with them. One thing the GEMs software will not automatically do is update the metadata associated with your imagery. To combat this it is important to keep a good record with you metadata so that others viewing your data will have an easier time interpreting it and understanding where it came from.

Summary:

With this being my first time analyzing data using the GEM software, it was a bit intimidating at first. Luckily a lot of the data analysis was done automatically making the process a little more streamlined and easier for a first timer like myself. The resulting processed imagery was good, but I am unsure whether it was the software or just the images, but in the NDVI imagery you can clearly see distortions that make the imagery at those points less than ideal. Given, it does a lot better of a job than I could do manually that is for sure. This equipment does not come cheap however and is near $8,000 to obtain the hardware alone, which I would consider a downfall for the technology for those who want to use GEM for individual use and don't have a large budget. Overall I would rate the GEMs as good, but there is still room for improvement. 

Wednesday, October 14, 2015

Field Activity 5: Gathering Oblique Images with UAS for 3D model Construction

Introduction:

All of the aerial photography that we have gathered thus far in the class has been taken with the camera pointing directly down at the ground, or nadir. This style of photography is good for producing two dimensional imagery, but doesn't have the depth needed to produce a three dimensional model.  To produce a three dimensional model, the camera must be shifted from nadir to oblique, where oblique camera angle will range between 0 and 90 degrees allowing us to gather images with more depth making it easier to develop a three dimensional model.

Study Area:

For this study, our group traveled to the Eau Claire Soccer Park again in Eau Claire, Wisconsin. The soccer park was a good location because at it's center was a concession stand which was the perfect size to gather enough imagery to create a 3D model with the UAS system that we had. The weather on the day of the study was mostly clear and sunny with very light winds to the south.

Figure 1: Concessions building that was surveyed outlined in red.
North is indicated by red arrow in the bottom right hand corner


Methods:


Figure 2: IRIS multicopter
photo courtesy of drnes.com
This study was done using two UAS systems; first the Iris and then the DJI Phantom. First we used the Iris which was programmed with mission planner to take images at certain intervals during the flight with a non-fisheye lens. The program for the image gathering was designed so that the Iris would be pointing it's camera at the building the entire time while it ascended upwards in a helical pattern from 15 to 26 meters. This program is also featured on the tablet format of mission planner as structure scan mode. Once it reached it's maximum altitude, the Iris then gathered images in a zigzag pattern to gather images of the roof structure. Following this, image gathering ended and the Iris landed.

Figure 3: DJI Phantom Drone
Picture courtesy of www.teamonerepair.com
The second scan of the building was done manually with the DJI Phantom drone. Everyone in the class took turns flying around the building and taking pictures with the camera mounted to the Phantom. The controller had a tablet mounted on it so that the operator could have a first person view of the image before capturing it by pressing a button on the controller. The angle of the camera could be controlled with a wheel on the controller but it mostly stayed at the same angle for the entirety of the scan. There wasn't a strict pattern that was followed when collecting this imagery so some people chose to take some images of the roof, while others to pictures around the perimeter. Images were collected until the Phantom had used two batteries.


Discussion:

This discussion will focus on the image collection, be expecting a future post on the processing of the imagery into a 3D model. Unlike the images that we were used to collecting with the Matrix, the images on the Iris were taken with a Go Pro and therefore were not geo-tagged. This can lead to challenges when trying to pinpoint the location of your 3D model on a software platform like Google Earth. Luckily, however there are other options. The first option you can use is to assign coordinates for your model in Google Earth. A second method you could use to aid in placing your model is a survey GPS. Finally, a program called Geosetter can utilize the telemetry log, match the way-points and time stamp data and infuse this information into the image to give it a set of coordinates. Needless to say, if you are collecting imagery from a device that doesn't geotag images, there are still many ways to do it after the collection.

In the pictures below notice the differences in how the oblique images give the concession building more depth than the nadir image that was taken in a previous study. Even if the roof heights and angles were known, it is also difficult to create a 3D model when you can only see the roof and nothing below it. With the oblique format you can see connections between the roof, walls and pillars along with other building features that are necessary in a detailed model.
Figure 5: Nadir imagery collected in a previous field activity
with the Matrix. Notice how difficult it is to see the angles
and height of the roof  structure and how this would be difficult
to derive a 3D model from
Figure 4: Oblique imagery collected with the Iris multicopter.
Notice how the oblique camera perspective allows for better
perception of depth which is essential to 3D imagery


Conclusion:

This field activity focused on the collection of oblique imagery to be used in the construction of a three dimensional model of a concessions building. Previous imagery collected in the nadir format, though useful for other means is not useful for producing a 3D model as is shown above. With oblique imagery you can image the faces of the building and capture more of the intricate surface details that would be useful in the creation of a 3D model.

Wednesday, October 7, 2015

Field Activity #4: Gathering Ground Control Points (GCPs) using various Global Positioning System (GPS) Devices.

Introduction:

In this field activity, our class experimented with various methods of collection ground control from the very accurate to the very approximate. Ground control points, also known as GCPs, are used to improve the quality of aerial imagery and data collection if gathered correctly. At their most accurate, you can measure out the altitude, latitude and longitude within millimeters. Accuracy is important when it comes down to collecting survey grade data which some companies may need when require geospatial data to be collected at high temporal frequency to monitor a development plot in the mining or agriculture industry for example over time.


Study Area:

This weeks field activity took place near the South Middle School/Southside Community Gardens of Eau Claire, Wisconsin where just south is a large open area with walking paths and a few small bodies of water. This location was chosen due to it's varying landscape and to provide a different location other than a soccer field complex. The study area fell inside and included the gravel walking path that surrounded the northern most body of water, which wasn't visible from ground level due to it being surrounded in tall grasses and weeds. Ground control points were placed along the path around this body of water and with three of the six being placed inside the path in the grass. The weather was clear with a considerable amount of wind to the West.
Figure 1: Image of study area from google images. Area studied is
 outlined in red and North direction indicated with red arrow 
in bottom right corner. 


Methods:

Six ground control points were placed around the study area. Each of the GCPs were made from tarp-like material with holes at each corner for nailing the GCP into the ground. Each side of the square GCPs was the base of a white or black triangle, whose points met at the center to form what could be described as intersecting black and white hourglasses. When placing the GCPs it is key to place them within the borders of the study area where they are visible from above, that way they can be seen and will not be warped by being near the edge of a image. The first GCP was placed on the gravel path just south east of the end of Hester St.
Figure 2: Nadir image taken with Matrix UAS above
the first ground control point.
The second GCP was placed South of the first in the tall grass approximately half way down the path before the first turn. The third GCP was placed South of the second at the first Eastward turn of the path. Approximately halfway up the Northeastern pointing path there was a thin gravel path that extended towards the small body of water, at the edge of this path the fourth GCP was placed. At the end of the Northeastern path where the direction changes to go Northwest, the fifth GCP was placed and finally halfway up that path to the Northwest, the sixth GCP was placed in the tall grass on the inside of the path. While placing the GCPs the altitude, latitude and longitude were taken with the Dual Frequency Survey Grade GPS which is a high precision unit that would act as a comparison the other GPS units used.
Figure 3: Dual Frequency Survey Grade GPS
on mounted system 2m above the ground at GCP 5
Figure 4: Topcon display connected to
the Dual Frequency Survey Grade GPS
showing the reading at GCP 5


Figure 5: Bad Elf GNSS Surveyor
(yellow) used in data collection
The class was then broken up into groups and each group collected data at the GCP for a different type of GPS unit. Each device was placed at the center of the GCP (Where the triangle points met) and a data point was collected. This was done at all six GCPs. My group collected data using the Bad Elf GNSS Surveyor GPS, a unit that should have accuracy to within one meter and tens of thousands of dollars cheaper than the first unit used. A tablet app was used to gather data with this device. The next group collected data on a tablet device with the even cheaper Bad Elf GPS which was not survey grade. Other groups collected data with the Garmin GPS and collected geotagged images with a smart phone. After these data points were collected, a mission was flown using the Matrix quad-rotor UAS to determine how accurate the sensors were and how they related to the GCP markers. After all experimentation was done, the temporary GCPs were collected.


Results and Discussions:


Below are some of the data sets collected by the the Topcon Survey GPS and Bad Elf GNSS GPS. Notice the precision in latitude and longitude of the 12 digit Topcon compared to the 8 digit Bad Elf.

Topcon Survey GPS
GCP:  Latitude,            Longitude,       Altitude
1:  44.7773757474,  -91.4729374398,  267.839
2:  44.7767401655,  -91.4729385628,  267.670
3:  44.7758957110,  -91.4728733066,  267.487
4:  44.7763877743,  -91.4721470321,  267.580
5:  44.7769016214,  -91.4711962560,  269.177
6:  44.7773686301,  -91.4723883271,  267.341


Bad Elf GNSS Surveyor GPS
GCP:  Latitude,  Longitude,  Altitude
1:  44.777397,  -91.472922,  267.839
2:  44.776792,  -91.472942,  267.670
3:  44.775911,  -91.472892,  267.487
4:  44.776406,  -91.472128,  267.580
5:  44.776922,  -91.471192,  269.177
6:  44.777378,  -91.472386,  267.341

Figure 6: Study area with overlayed GPS location as recorded by the various units described on the key in the bottom right-hand corner for purposes of analysis of accuracy the XYZtopconsurveygps should be used as the most precise coordinates.
One of the main goals of this activity was to experiment with collecting GCPs with various GPS devices and determine their accuracy. If you refer to figure 6 above, you can see that the different GPS devices were indeed varying in their capability to provide accurate coordinates. It was expected that the most expensive and precise Topcon would outperform the rest in terms of accuracy and that appears to hold true. It was also expected that as you downsize in price range down to the collector app of an iPhone that the quality of data would decrease. Based on figure 6 we can see this theory is only somewhat true. Based on the image we can see that the iPhone does produce some obscure points around GCPs 5 and 6 on the right of the image, but the one that produces the most obscure results is the Bad Elf pro collector which is a surprising result.

As you can imagine the cheaper alternatives to the Topcon were easy to used and to collect data from with minimal set up at each GCP. All the user had to do is place the device approximately near the center of the GCP and click a button to record the point, however this simplicity shows in the accuracy. If you want to get precise data for high frequency collections to observe changes it is necessary to use precise equipment. Though it was time consuming to stabilize and re-stabilize the Topcon at each and every GCP it did provide accurate measurements that can be analysed over many surveys to be used in a commercial regard.

If you want to gain accurate and useful data it is important to have enough GCPs. It is key that you have no less than 3 GCPs for you study area. The number of GCPs also depends on the terrain. The more variance in elevation, the more GCPs you will need, likewise, the more monotone the study area, the more GCPs you will need to help stitch the images together. Obviously the more GCPs you have the more time consuming the process of collecting accurate data will be, however, your data will be more useful if you do this.   

Conclusion:

In this field activity, various types of GPS units were used to collect data at six different GCP locations. It was shown via the Topcon that the more time and expense it took to gather a point, the more accurate the data you will receive. However, cheaper survey grade devices had some accuracy, and could be used to collect data over a single study. The GCPs we used were only temporary, and therefore useful for a short term study like ours, but for in a commercial study our methods would not have been accurate and we would want to elect to use more permanent GCPs. 

Wednesday, September 30, 2015

Field Activity #3: Using a multi-rotor to gather imagery/Using mission planning software.

Introduction

This week, we utilized the information that we learned in last week's field activity and flew automated missions using a multi-rotor UAS. This field activity helped us gain more experience planning missions with the Mission Planner software, engaging in pre-flight checks before every mission, updating flight logs, and staying engaged at a certain position (pilot in command, pilot at the controls and spotter) while the mission is taking place.

Study Area

For this field activity we chose to return to the Eau Claire Soccer Park in Eau Claire, Wisconsin. This complex provides us with spacious field with a minimum public presence during the late afternoon/early evening before soccer games begin. A wide open field with minimal people is important when flying multi-rotor UAS missions especially in the event of a malfunction or crash it is important no one is injured. Our survey mission was flown over a concession/restroom building that is located at the center of the park. The skies were overcast with light winds from the South.
Figure 1: Study area for this field activity. The mission was carried out in approximately same region as is outlined by the red box and North is indicated by the red arrow in the bottom right hand corner.


Methods

Upon arriving at the study area, the computer containing Mission Planner was booted up and the modem was attached. The modem was then attached to the Wonder Pole and raised into the air to its full length. For these missions we used the Matrix multi-rotor UAS. The Matrix was removed from it's container and assembled. The mission plan was created, a flight log was started and the pre-flight check was done. After the pre-flight checks, the mission was run. Each mission took about 6-7 minutes to complete and the data was saved to the sensor for later review. Two additional and identical runs were made with a Cannon SX260 camera with CDHK installed, the first with an RGB camera and the second with a near IR camera. A timer was set on both cameras to specify a time interval for image gathering, but could only be an estimate since the cameras were not linked to the Matrix hardware. After these missions were run, a post flight check was completed and the base station was dissembled.

Figure 2: Matrix multi rotor UAS


Results and Discussion

Three image gathering methods were used in our survey. The first method used was gathering image data from the sensor that was already mounted on the Matrix multi-rotor. This sensor was programmed to take images based on the mission planner software which takes into account the field of view allowing for acceptable amounts of overlap between successive pictures and passes. Two types of images were taken, one in full color RGB and one which was monochromatic. Below you can see that both Figure 3 and Figure 4 were products of the sensor imagery since both the images produced are nearly identical in position and orientation. The accuracy and overlap can be visualized in Figure 5 where I overlayed three photos to show photos one after another and in a separate pass. These images were so easy to overlap that I was able to do it in a Word document. This attests to the UAS's ability to maintain a very consistent altitude as described by the programming.
Figure 3: RGB photo capture from sensor mounted on the Matrix
Figure 4: Monochromatic photo capture from sensor mounted on Matrix

Figure 5: An overlay photo showing the overlap of the imagery collected by the sensor of the Matix. The blue box depicts the original picture depicted in figure 3, the red box depicts the next picture taken by the sensor and the green box  at the bottom shows the overlap of the photos taken in the next row pass.

The photos taken with the Canon SX260 cameras were not as accurate as the sensor imagery, but this is because they ran on their own platform instead of being programmed with the mision planning software. Since we had to use a simple "photo per time interval" approach, the overlap here was not as good. However, we were still able to gather some imagery as seen below in figures 6 and 7 with the near infrared and RGB cameras respectively.

Figure 6: Near IR imagery from Cannon SX260 camera
mounted on Matrix multi-rotor in place of first sensor
Figure 7: RGB imagery from Cannon SX260 camera 
mounted on Matrix multi-rotor in place of first sensor


Conclusion

This field activity allowed us to use a hands on approach to mission planning and carrying out a mission while reinforcing the concepts of maintaining a flight log and carrying out a pre-flight check. The RGB and monochromatic imagery that we collected with the sensor hardware connected with the software of the Matrix multi rotor turned out to be better than the camera imagery being taken from its own,separate platform. The imagery from the sensor apparatus was also able to show us just how accurate the altitude of the UAS is when it is running autonomously.

Wednesday, September 23, 2015

Field Activity #2: Using mission planning software and multi-rotor preflight checks

Introduction

For our second field activity, we learned how to use and develop surveying missions to be programmed to a multi-rotor using mission planning software, as well as running through the preparation for a multi-rotor flight. Mission planning and preflight checks can make or break a survey and therefore proficiency and thoroughness in both of these aspects is integral in collecting useful data and preventing the destruction of expensive equipment. This activity was carried out in a computer lab in Phillips Hall and the preflight check was done between Phillips Hall and Davies Center.

Mission Planning Software Methods
Figure 1: Mission Planner logo

The first step in flying a programmed mission is using the necessary software to design and plan said mission. This can be done with a program suitably called Mission Planner. When you enter Mission Planner, you are prompted with a world map. From here you can zoom in on the location in which you want to conduct your mission and begin planning it. Before planning a mission it is important that your mission area will not interfere with any no fly zones or other hazards like hospital helicopter routes. Airport no fly zone radiuses are depicted as purple circles on Mission Planner and have to be avoided. Once you find your area to conduct a mission, begin planning using the tools they provide. A simple point to point mission can be created by clicking on the map and selecting waypoints. Each waypoint can be customized to a certain altitude, speed in which it is reached, whether or not it is a take off or landing point and more. All this information from the actual mission will be stored in the telemetry log which will show what the UAS did in reality. waypoints can also be automatic using the drop box and creating various shapes like circles or boxes.
Figure 2: Mission Planner interface using a waypoint circle. Notice on the bottom left the ability to edit each waypoint

If you are using mission planning for surveying you can click <Auto WP to survey> and when you create a box on the map, an automatic zigzag pattern will appear. There are a variety of options to alter this pattern which will appear on the right side of the program. You have the ability to select your aircraft and camera, adjust speed, altitude and these adjustments will display on the mission. The program takes into account field of view and therefore if you do a mission at a high altitude, you will perform less zigzags and the mission will go faster. The opposite is true for a low altitude mission. The lower the altitude, the smaller the field of view and in order to get proper overlap for surveying, more zigzags must be made, lengthening the mission. It is important to find a happy medium between these too so that your mission does not exceed the time your battery will last. Mission length is calculated at the bottom of the screen automatically making it easy to determine which way you need to adjust your flight parameters. Once you have a mission that you want to fly, you can save it to be later uploaded to a UAS.
Figure 3: Waypoint Box Survey interface. Notice the right hand side displays aircraft selection, speed, altitude and preferred flight time. Also notice camera selection ability and mission area editing. Below you can see estimated flight specs such as total distance, distance between lines, flight time, area covered, and photo interval suggestion. To the left notice enlarged stats
Flight Preparation Methods

After planning a mission, you and your team have to travel to your study area with your UAS of choice and prepare to fly. It is very important that every measure is taken to ensure a successful and safe flight and his can be accomplished by following a preflight check such as the one below
Figure 4: Preflight Checklist

Before the preflight check, it is important to assign roles to each team member to ensure all facets of the flight are accounted for and monitored. There three positions that need to be filled. The first is the individual who focuses on the computer known as the pilot in command (PIC). The PIC's job is to fill out the preflight check by communicating with the pilot at the controls and set up the modem so the computer can communicate with UAS. The modem is attached to the computer via a USB connection and then is attached to the top of a "Wonder Pole" which telescopes upwards to establish a stronger connection to the UAS when it is in flight in an attempt to avoid communication issues caused by extraneous signal noise nearby. The PIC will also upload the mission plan to the UAS and ensure each step is accounted for as to not send the UAS on back to its last mission. During a mission, the PIC will be focused solely on the computer ensuring proper signal strength and satellites are obtained
Figure 5: Base station set up with wonder pole.

The second position is the pilot at the controls (PAC). This individual is in charge of physically checking to make sure all of the components the PIC is listing off in relation to the UAS and transmitter in the preflight check are in good operating condition and turned on. During a mission, the PAC is always at the ready with the transmitter to assume control of the UAS in instance where a mission becomes too dangerous (eg. oblivious citizens or other manned aerial vehicles present) or satellite signals are lost causing the UAS to lose GPS capabilities. This is why it is important that the PIC and PAC have good communication and remain focused even when a program is controlling the UAS.

Finally, a third position is the spotter. The spotter is in charge of assisting the PAC when needed with the preflight check. They can help with any last minute repairs or wherever they are needed. During a mission the spotter assists in keeping a visual on the UAS as you can never have too many people keeping an eye on the mission and making sure everything is running smoothly.

As you can see on the preflight check mentioned above, there are a lot of things to check and that is good. The more you take the time to check, the less likely you are to have a failed mission. I wont describe all of the checks since some are self explanatory, but there are some that have more too them that are good to know in order to have a successful mission. The first thing the PIC fills out is the Multicopter Log which asks for date, time, individuals acting as PIC, PAC and spotter, battery voltage and percent (both before and after), flite time, battery name, and the weather. It is important when filling out the battery information that you use voltage and not percent. While the may actually be half charged, once you plug it in it will display 100% since the computer considers that to be full charge. If you fly according to percent battery and the voltage is low, there is a good chance your UAS will lose charge and crash. It is also a good idea to check your computer battery to ensure that it will be functional throughout the whole operation.
Figure 6: Multirotor (Matrix) used in preflight check

Upon completing the multicopter log, the PIC then can begin the preflight check. This process involves the PIC yelling out the checklist to the PAC and the PAC responds with "good" or "okay" once the item in question is functional. The first few checklist items are to ensure that multirotor is structurally sound and connected. This means checking to see that the legs, frame, wires, battery and propellers are free of cracks, loose screws, dirt, worn down areas and anything else that might threaten the stability of the craft. It is important the check to make sure the battery is not only secure, but also in balance with the rest of the multirotor. An unbalanced battery can cause rotors to work too hard to level out the craft draining the battery quicker or cause it to not function properly all together.  The next part of the check ensures that the wireless communications are functioning and connected. This includes making sure Antennae are secure and out of the path of the propellers, connecting the sensor, turning the transmitter (TX) on and powering up the UAS. Once this is done the PIC makes sure the modem is connected, and that the base station is connected to the UAS. This is the computer in conjunction with the modem and wonder pole. Next the mission planning software is accessed and is connected to the UAS via a detected number (eg. 50600). A loading bar will appear and afterwards the platform will show up on a map via GPS. At this point you can look at the number of satellites currently connected to the UAS and make sure that this number never falls below 6. The more satellites connected, the better the UAS can position itself in three dimensional space. Lose that capability and your mission could fail. Another helpful number displayed on the mission software is the h drop. This number displays the horizontal differential position a number you want to be low.
Continuing on with the preflight checklist, the battery voltage and percent need to be documented again, and once the mission is uploaded, all the waypoints are written and the sensors are on and ready the UAS is ready to enter the takeoff sequence.

Before taking off it is important to clear the area of all spectators. THIS IS VERY IMPORTANT. Though UASs are cool, they can be dangerous if handled incorrectly or if others are acting carelessly around them. To prevent unneeded injuries it is important to make sure the area around the UAS is cleared. Before activating the UAS it is important that the TX throttle is down so that when it is connected with the UAS, it doesn't cause it to throttle up unexpectedly. The kill switch on the TX is then deactivated and the TX is armed. The multirotor is then sent up into a loitering mode and satellite connectivity is checked again making sure that number does not fall below 6. The mission is then free to begin. Upon completion of the mission, the UAS will return and the base station, battery and TX can be disconnected. The sensor should be checked again too.

Discussion

There hasn't been any data collected from this activity yet, but it was interesting to have a hands on approach to creating a UAS mission and preparing and arming a UAS for flight. Learning about the necessary steps and precautions needed to be taken before operating a UAS was a surprisingly long, thorough and much more necessary process than I thought it would be before coming into this weeks class. All UAS operators of all backgrounds should follow a similar process in preflight checks to ensure the safety of themselves and those around them. If  accidents occur because of careless flying of UAS it could be detrimental to the viability of this technology for use in the public domain.


Conclusion

Mission planning and having a thorough preflight check are important components in any successful surveying mission. Any deficiencies in either can lead to failed missions or even worse, destroyed equipment or physical injuries. Anyone who wants to conduct UAS missions must be strict with following safety guidelines and have a good handle on the functionality of their UAS for their safety and for those around them.