Volumetrics as it relates to geospatial analysis refers to the calculation of three dimensional data from collected survey data, whether that data is collected via a ground survey crew, by areal photography with UAS or other means. A situation where you would need to employ volumetrics, is if you were tasked with analyzing the volumes of natural or man-made objects that are scattered throughout a study area, such as hills, piles of mined materials, buildings or pits. This situation often arises in the mining industry where a company may require knowledge of the volumes of their material stockpiles or the amount of material that has been removed from the mine. Initial data can be collected in a variety of ways as mentioned above through ground survey crews or UAS. Hiring a whole crew to survey a mine can cost a large amount of time and money depending on the size of the survey, while a UAS operation can photograph the entire area from above and software methods can be employed to process the data. Most companies wanting to save money would most likely choose to conduct a UAS operation, and with improvements being made to software programs on a regular basis, they are becoming more and more accurate at processing volumetric data. Software programs such as ESRI's ArcMap and Pix4D provide the necessary tools for you to perform volumetric calculations of processed geospatial data with relative ease.
For the following three tests of software volume calculation ability, previously collected data collected of the Litchfield mine is used. This data was collected via UAS, but was not collected in the geography 390 course. Three aggregate piles were selected to be analysed for each of the three tests performed.
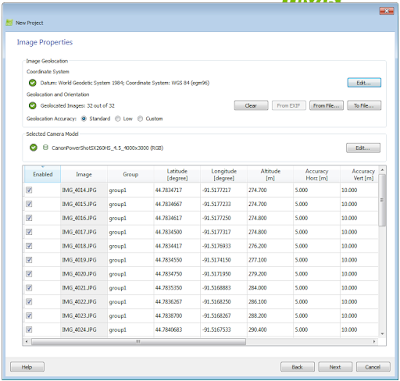
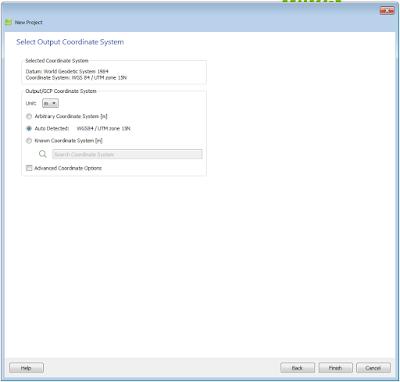
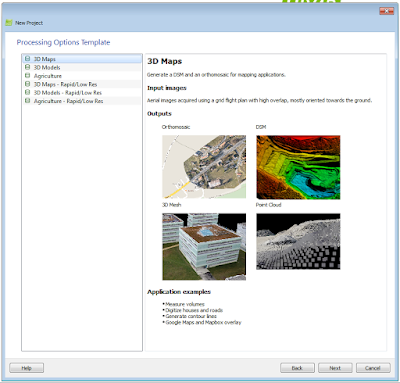
Using Pix 4D to Calculate Volume
 |
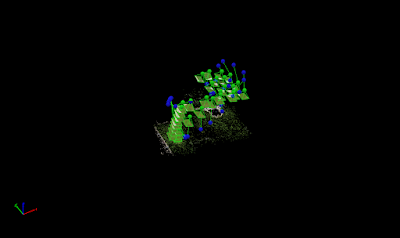
| Figure 1: Calculating the volume of a pile in Pix4D using the volume tool source:http://npb-uas.blogspot.com/ |
Using ArcMap to Calculate Volume From Rasters
The ESRI program ArcMap also has the ability to calculate volumetric data. The first way that was tested was through raster clips. Within the geodatabase created in ArcMAp, a feature class polygon was created for each pile, making sure that the polygon encompassed the pile with a large enough border of flat ground to be used as a standard plane in which to gauge the starting height of the pile. Once the polygon was created, an extract by mask was done to make the each pile its own separate entity from the initial raster so it could be manipulated. The identity tool was then used to find the plane height, or ground elevation surrounding the pile. This was done, simply by selecting the identity tool and then clicking the area of interest to get elevation data. Several points were analyzed and an average height was taken note of for each pile. Finally, the surface volume tool was used. When opened, the surface volume tool prompts you to select your input surface (pile raster), output file (where you want the text file data saved), Reference plane (Calculate volume above or below plane), Plane height (Average height calculated with identity tool), and Z factor (should be 1). When the required information was entered, the OK button was pressed and a text file containing the volume of the pile was created. The map in figure 2 shows the piles labeled along with the volume that was calculated using this method
 |
| Figure 2: Litchfield mine map created with ArcMap showing the labeled piles and their calculated volumes using the surface volume tool on raster clips. |
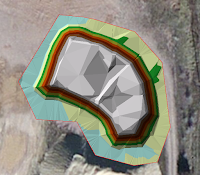 |
| Figure 3: Pile 1 TIN |
A TIN or Triangulated Irregular Network uses triangulation for a given number of points to create better surface definition for a selected area. The raster clips used previously are easily converted to TINs by using the Raster to TIN tool which converts the raster into what looks like a colorful topographic model seen in figure 3. When using the Raster to TIN tool, the more triangulations you specify the better the surface definition, however, more triangulations means a longer processing time. The next step in using TINS to calculate volume is adding surface information. This can be done with the Add Surface Information 3D analyst tool which lets you analyze each pile individually for information such as Z_Max, Z_Min, Z_Mean, Surface Area and Slope. The Z_mean value is important because it provides a average elevation which will eliminate outlying elevation values for better results when calculating the volume. Next, the Polygon Volume tool is used to calculate the volume of each pile. Here, we use the data of Z_min found in the previous step to designate the minimum height of the volume calculation and then calculate the volume above that point. Once this is done for each pile, data collection is complete. It is important that the polygon volume tool is used because other volume tools like the surface volume tool used to calculate volume of the raster clips aren't compatible with TIN data, and won't take into consideration the surface information that was collected.
Conclusion
The above table contains the data that was collected in this activity through collecting volumetric data from three aggregate piles using three different methods. There are obviously differences in this calculated data, and there isn't a way to tell which is the most accurate without knowing the volume definitively. However, the TIN data seems to be significantly different from the other two methods . The TIN data could be so far off because of when the TIN was created, not enough triangulations were made, and as we found out before, the number of triangulations is directly related to the quality of the TIN. Perhaps increasing this number will bring the TIN volume closer to that of the Pix4D and raster methods. Based on quickness and simplicity, Pix4D would be the most efficient method for calculating volumetric data. It may even be more accurate since for the raster clips, a baseline Z value was, in a way, arbitrarily chosen which increases it's inaccuracy. Another factor that would factor into volumetric calculations in industry would be the availability of software. With the high price of Pix4D, some companies may not have it and therefore other software must be used. If quality time is spent analyzing the data, ArcMap raster clips can be just as accurate.


